I started writing this post on the 12th of March, but between work and fatherhood there isn't much time for blogging these days. As Magnus Magnusson would say, I've started so I'll finish ...
If you haven't yet read this article by Christopher Snowdon, I highly recommend it:
the [ONS's] General Lifestyle Survey is, as Ron Burgundy might say, kind of a big deal. It is the main source of statistics for alcohol consumption and I couldn't help but feel, as I read the Beeb's report, that there was something they weren't telling us.I checked the ONS report myself. Here's the data from Table 2.1 with an added column showing the drop for each category:
Sure enough, the text of the report tells a very different story...Between 2005 and 2010 average weekly alcohol consumption decreased from 14.3 units to 11.5 units per adult. Among men average alcohol consumption decreased from 19.9 units to 15.9 units a week and for women from 9.4 units to 7.6 units a week.That, folks, is a twenty percent drop in the nation's alcohol consumption in just five years. Is that not newsworthy? Why wouldn't a state broadcaster think licence-payers would want to know a fact like that?
When a few medics wrote a letter to the Telegraph calling for minimum pricing, that was considered newsworthy.
When the Lancet picked a number out of the air and extrapolated it over twenty years, that was considered it newsworthy.
When alcohol-related deaths increased by a statistically insignificant amount, that was considered newsworthy.
But a twenty percent drop in alcohol consumption? Nah, who'd want to hear that? After all, it's hardly going to help the campaign for minimum pricing and a total advertising ban if people discover that the Booze Britain narrative is a myth.

That's a drop for both men and women, in every age group. You'd think the Health Nazis at the BBC would be dancing for joy.
Table 2.2 shows the percentage of people exceeding specified amounts in an average week:

That's a drop in every category except one (the percentage of old ladies drinking more than 35 units stayed the same).
Table 2.3 shows drinking patterns for the week leading up to the interview:
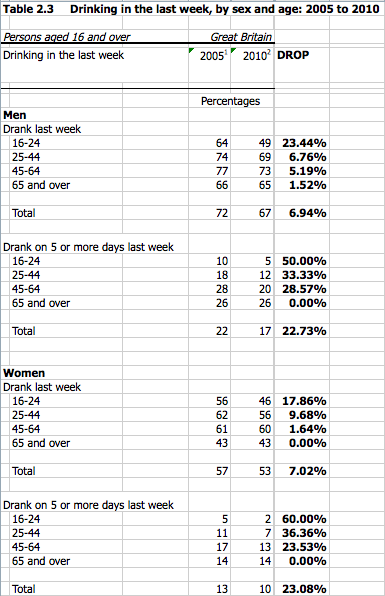
For both men and women, in every age group, people are drinking less than they did in 2005 (except for the oldies, who have stuck to their drinking patterns).
It's not until Table 2.4 that the temperance nuts can find anything remotely resembling bad news:

The percentage of men 65 and over drinking more than 4 units in a day has risen from 21 to 22, while the percentage drinking more than 8 units has risen from 6 to 7. Scary stuff!
And Table 2.4 is still overwhelmingly good news from the perspective of those who want us to drink less. The percentage of 'hard drinking' grannies stayed the same at a whopping 2 percent. In every other category, people were drinking less, with the biggest drops in the 16-24 age bracket. Only a third of young men exceeded 4 units (2 pints of Tetley's), and only a quarter exceeded 8 units (3 pints of Kronenbourg), down from about a half and a third, respectively, in 2005.
On almost every metric, Britain is less boozy than it was in 2005. And yet here's the spin we get from the BBC:

Adults aged over 45 are three times as likely to drink alcohol every day as those aged under 45, results of a lifestyle survey suggest.That older people drink more often than younger people is not news. Look back at those charts. In 2005, only 10% of men aged 16-24 drank 5 days or more in the week before interview, compared with 18%, 28%, and 26% for those aged 25-44, 45-64, and 65+. Women's drinking shows a similar progression (5%, 11%, 17%, 14%).
Although younger adults were less likely to drink every day, the survey suggests that they were more likely to binge drink than older adults.Shocking!
...
The survey also found that men tended to drink more often than women
Never mind 2005, what about the difference between 2009 and 2010? Overall, alcohol consumption fell by 3%. It fell 11% for those aged 16-24; 1% for 25-44; 4% for 45-64; and 1% for 65 and over. So even compared to last year, we're drinking less. If the BBC were honest and unbiased, their headline would have read "Alcohol consumption continues to fall". But as Chris Snowdon says, that wouldn't help the campaign for minimum pricing (which seems to have finally succeeded).
It's bad enough that we suffer propaganda from a bunch of compulsorily-funded zealots at the BBC. But it seems that the compulsorily-funded statisticians at the ONS also believe that drinking is a problem, and that this is the government's business:
How the data are used and their importance
The Department of Health estimates that the harmful use of alcohol costs the National Health Service around £2.7bn a year1 and 7 per cent of all hospital admissions are alcohol related. Drinking can lead to over 40 medical conditions, including cancer, stroke, hypertension, liver disease and heart disease. Reducing the harm caused by alcohol is therefore a priority for the Government and the devolved administrations. The GHS/GLF is an important source for monitoring trends in alcohol consumption.
£2.7bn sounds like a lot. That's £2,700 million. So how does it compare with what the government collects in taxes on alcohol? Let's have a look at another report available from the ONS: the Alcohol Duties Statistical Bulletin - December 2011:

Chart 1B shows 2011/12 year-to-date (April to February) Total Alcohol Receipts are £8,678m, which is £68m (0.8%) less than the same period in 2010/11.Now, I'm sure that "harmful use of alcohol" has costs to individuals and organisations other than the NHS, but only public costs should concern the government. Do the non-NHS public costs really add up to £5.978 billion?
I don't know what's more disturbing - that the government churns out this propaganda, or that people believe it. Either way, it's enough to drive any sane person to drink.
Don't forget to add VAT to that government income from alcohol figure. ;)
ReplyDeleteGood point!
ReplyDelete